


Site Guide
Learn more about Planet Hunters
GUIDE
PLANET HUNTERS
Tutorial Video
GO TO TOPSorting the Light Curves
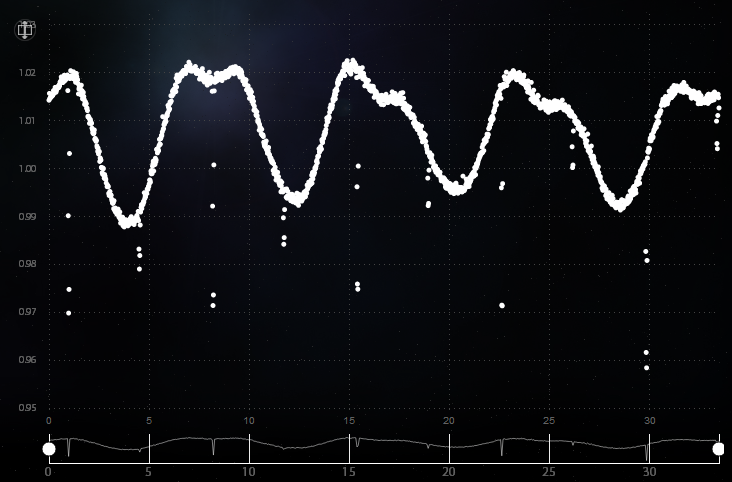
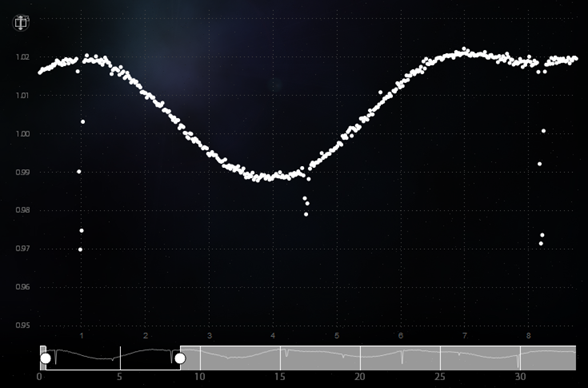
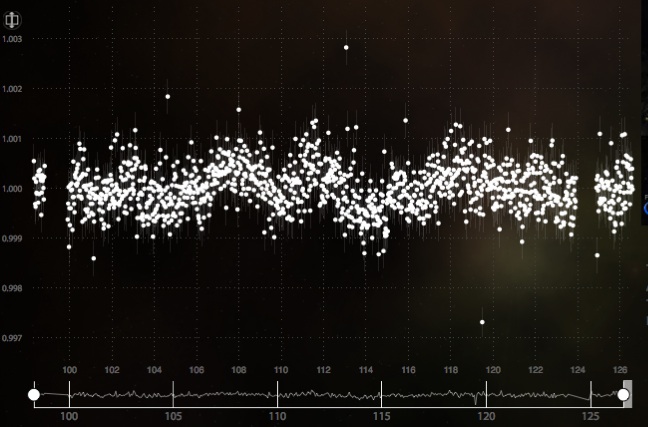
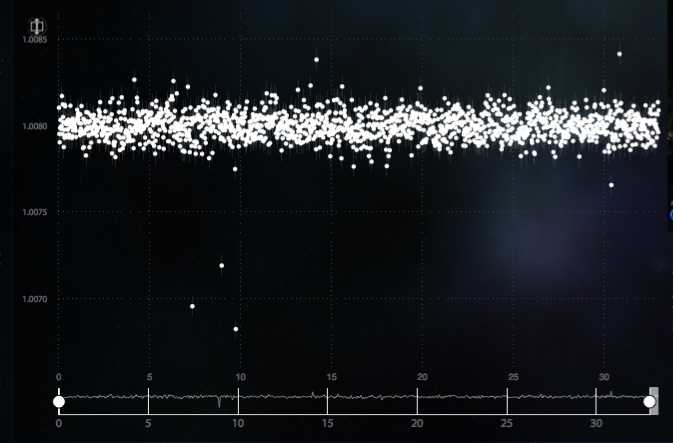
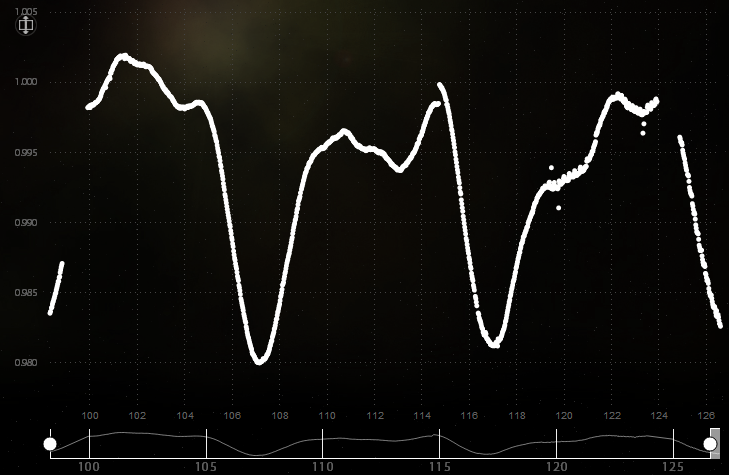
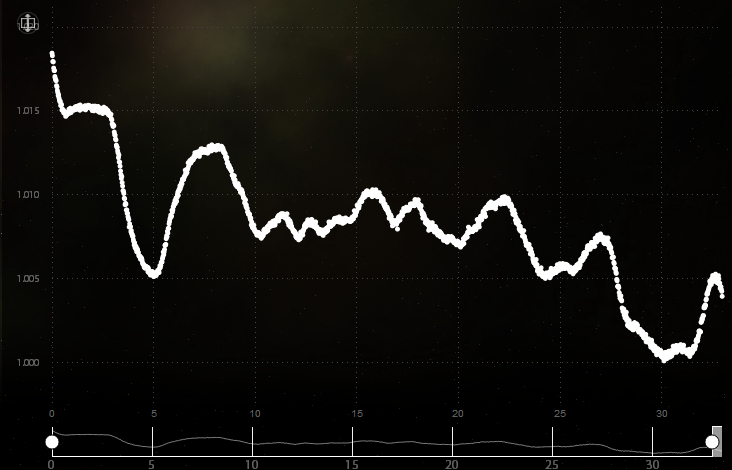
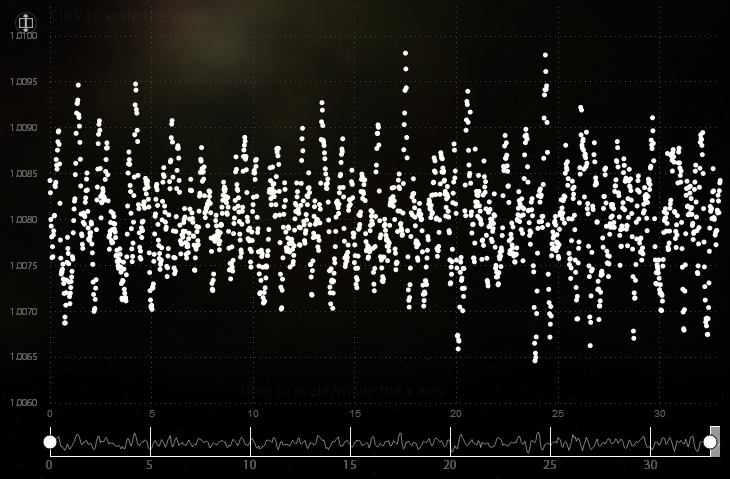
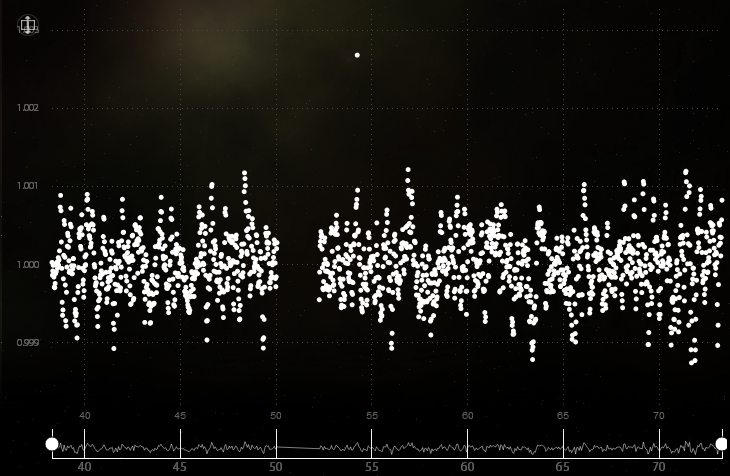
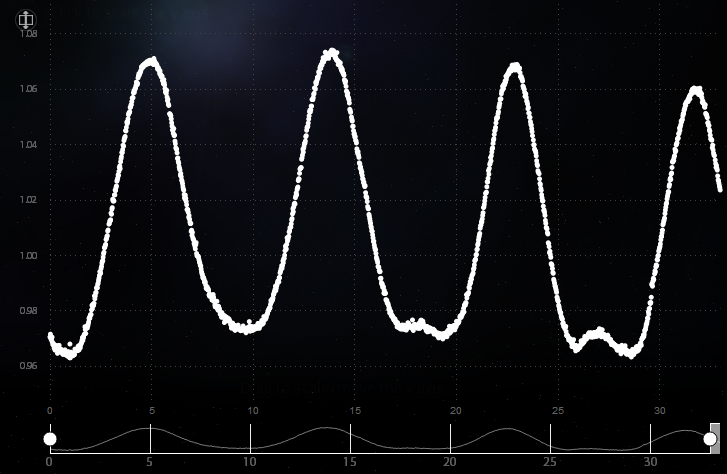
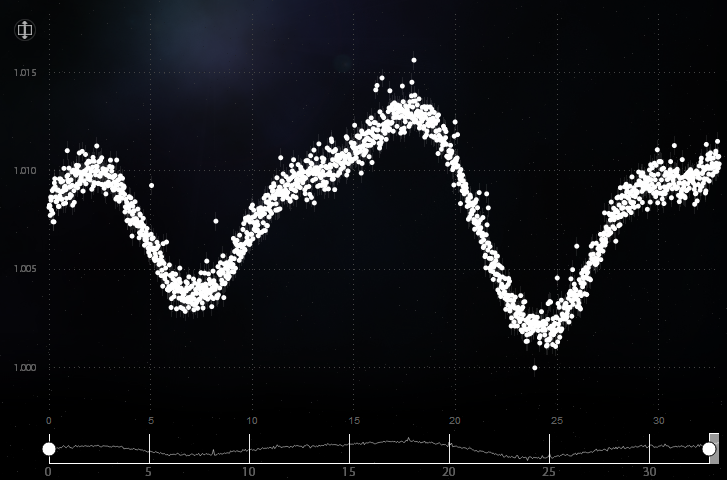
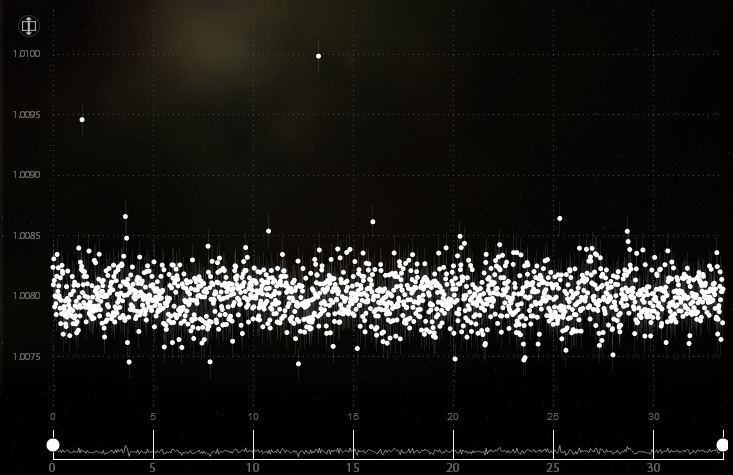
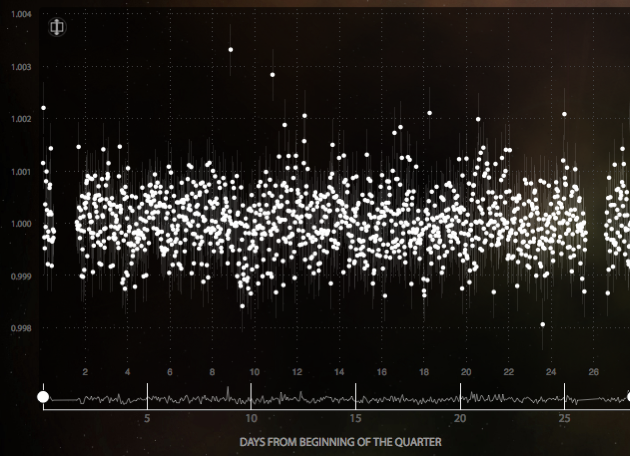
You will be looking at changes in star brightness at a level that has never before been seen. As you sort through the light curves, you will notice different patterns. In many cases, the data scatters in a relatively flat band of points, like the cases shown in Figure 1. Most of this scatter is simply the inevitable noise that comes with any measurement. Other light curves, like those in Figure 2, are obviously variable with time. We think that most of the variability (on timescales of hours to days) is caused by starspots or pulsations. Having Planet Hunters sort families of similar light curves is part of the important scientific research.
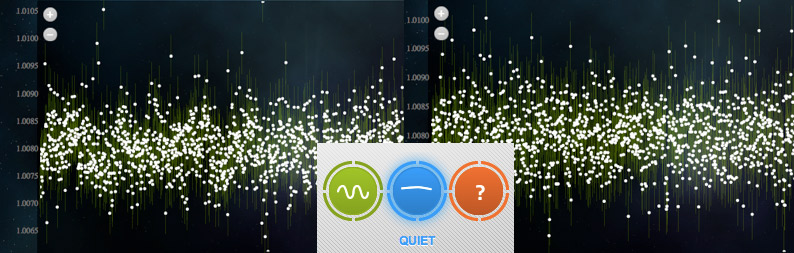
Figure 1. Even precise measurements are not exactly perfect or reproducible and cause low-level scatter in the data. There is no visible pattern, just white noise, and so these light curves are best categorized with the middle 'quiet' icon.
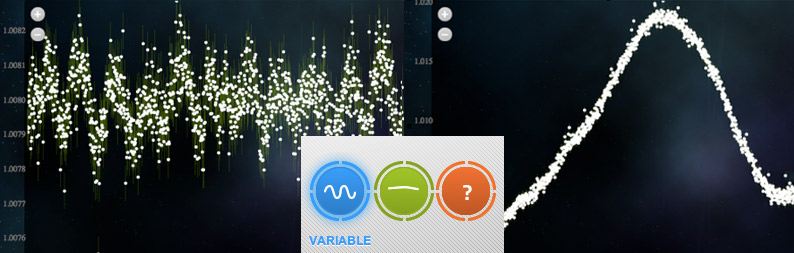
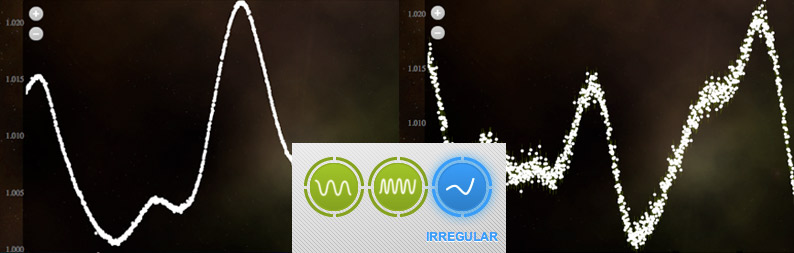
Figure 2. These light curves should be tagged with the “variable” icon; then you will be asked to decide if the curve is pulsating with one cycle (like the top left curve) or regular (like the top right curve) or irregular (like the bottom curves).
It is challenging for computer algorithms to classify variable patterns so participants are making a particularly important scientific contribution in this step. We will obtain follow-up data at the telescope to understand the underlying mechanisms for these different families of variable curves and to confirm transit candidates.
Flagging Transit Events
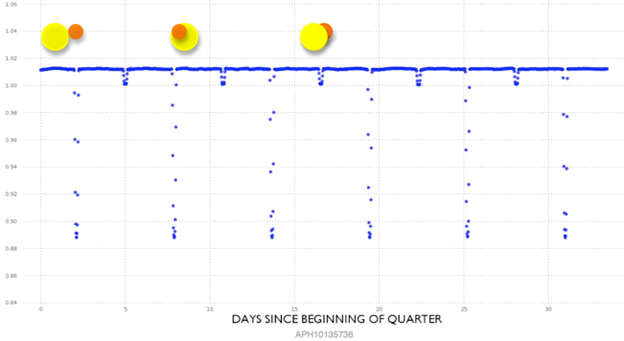
However, the real treasure hunt is for transiting planets and these present as a relatively sharp dip in brightness in the light curve (Figure 3). A transit could appear in either a quiet or a variable curve. Indeed, it will be more difficult for computer algorithms to find transits imposed on the variable light curves, so we hope that Planet Hunters will pay particular attention to these.
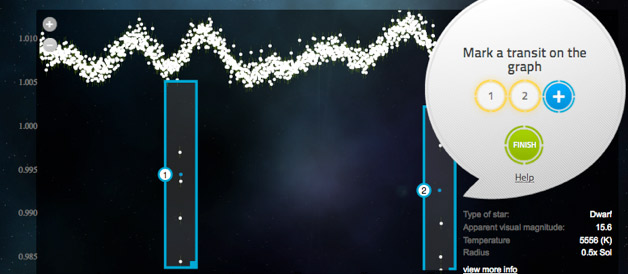
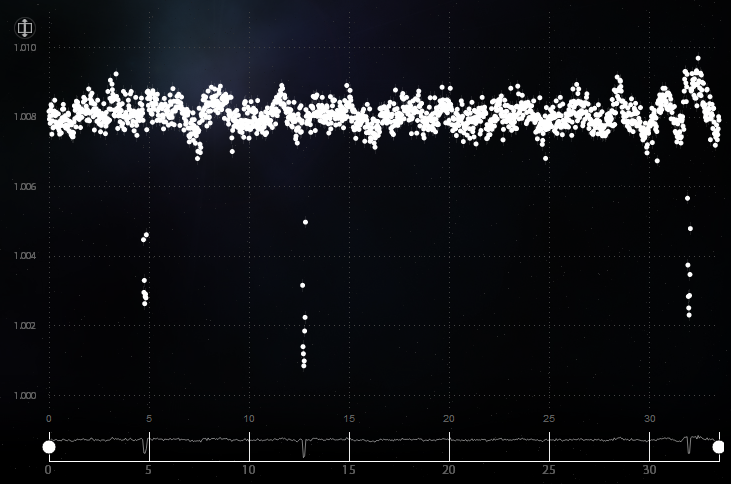
Figure 3. After sorting the light curves as quiet or variable, Planet Hunters will be asked if there are any possible transits in the data. If low points are seen, then answer 'yes' and click on the icon to create a box that can be positioned over the transit features.
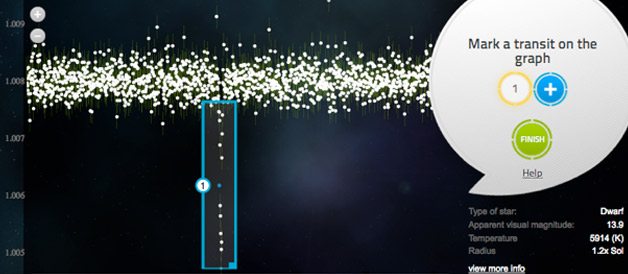
The size of the planet is reflected in the depth of the transit points. Earth-sized planets will exhibit a dip in brightness that is buried in the noise of the quiet light curves in Figure 1. The transit events in Figure 3 are for planets that are several times the radius of the Earth.
The time it takes a planet to complete one orbit is called the orbital period. For transiting planets, this can be determined by counting the number of days from one transit to the next. The examples in Figure 3 are fairly obvious. Planets in longer period orbits will be more challenging to detect, both for humans and for computers because a transit will not appear in every 30-day set of light curve data. Just because you don't see a transit in the first block of data doesn't mean that there won’t be a transit in another set!
Large planets with short orbital periods are the easiest ones to detect. The most challenging detections will be small planets with long orbital periods. These will require patience and care, but are the real treasures in the Kepler data!
Example Transits
Here are some examples of transits that the Planet Hunters team has collated. These are good prototypes, but remember that not all transits are quite as obvious or look exactly like these. Don’t worry if you are unsure if what you are marking is a transit- if you think it looks like a transit, tell us! Each curve is seen by many people, so go with your instinct—if others agree, they’ll mark it too.
Simulated Transit Events
If you've classified a lot of light curves, odds are you have run into a simulated transit event. To create these, the Planet Hunters team takes real light curves and adds transit events for different planetary radii and orbital periods. Don't worry if some of them seem too easy, they should, as big planets with short-period orbits around small stars should produce a clear signal. Similarly, you may run into simulations that seem difficult or downright impossible to detect. Don't despair though, finding small planets is hard. Both easy and nigh-impossible simulated transits are important in order to find out what kind of planets the project is good at detecting and what planets are harder to find. We will always identify the simulated transit points in red after you've classified the star and list the radius and period of the simulated planet we injected into the light curve. For more information on what we do with the information from simulated transit curves, go to the science page.
GO TO TOPThings You Might Encounter
Eclipsing Binary Stars
Have you seen any weird looking mesh patterns in the light curves? Or have you seen enormous transits with a smaller dip halfway in between? If so, you may have run into binary stars, a topic that Debra Fischer discusses on the blog here and here.
Binary stars are exactly what they sound like—two stars that orbit each other. They often look like a single point of light when viewed from Earth, but many of them can be resolved as two separate stars with some magnification. More notably though, they can transit each other just as exoplanets do and these transits show up in the light curves. There are certain features of an eclipsing binary transit that are readily identifiable on a figure like this:
What it shows is a characteristic large dip with smaller dips occurring typically halfway between the major dips. The large dips occur when the smaller (and less luminous) of the pair crosses in front of the larger one, blocking an area equal to its size. The small dip occurs when the smaller star is blocked from view as it passes behind the larger star. Another characteristic feature of an eclipsing binary transit is extreme depth. This light curve shows a drop of nearly 12% in the brightness of the system during the larger transit, which is only possible with stars transiting other stars. Most exoplanet transits are less than a 1% drop. Binary stars can also include an intrinsically variable star in the system resulting in light curves like this:
Again, we can see the larger transits and the smaller transits in between. Here is a close up of the first three transits from this light curve:
When you encounter a light curve with transits, don't worry about whether it is an eclipsing binary or an exoplanet. We'll worry about that, just mark everything that you think is a transit. In fact, there may be exoplanet transits in the same light curves as eclipsing binaries.
Multiplanet Systems
Given that our own solar system has eight planets, it should come as no surprise that we may find other stars with multiple planets around them lurking in the Kepler data. These light curves would look exactly as one might guess, showing multiple patterns of transits.
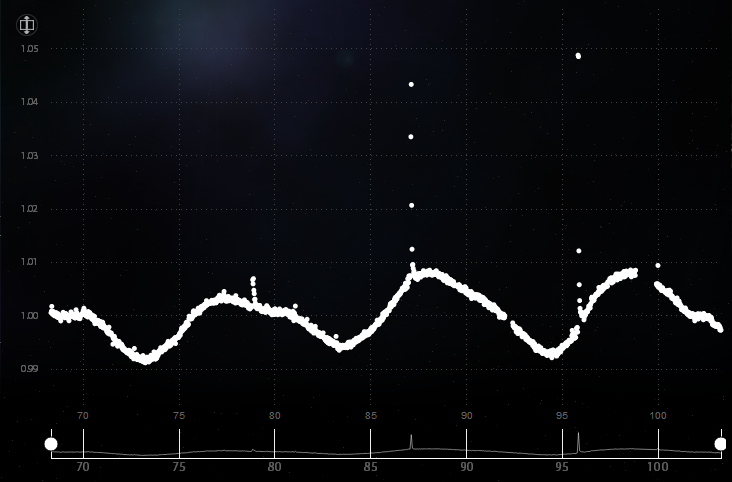
This light curve is for the star Kepler-9, confirmed to have three planets, Kepler-9b, Kepler-9c, and Kepler-9d. Two of these have transits deep enough to see at this zoom level (the third is much smaller and has a very short period). We can see that there must be multiple transiting objects because the timing between the transits is not constant due to the overlapping of two different periods. An exoplanet around an eclipsing binary star would also look similar, displaying both the small and large transits of the stars as well as whatever transit the planet causes. If you encounter a light curve that looks like it may be from a multiplanet system, mark the transits as usual. Then, let us know about it in the discussion and talk pages, we are really interested in looking at these systems!
Stellar Flares
Another anomaly that you may find when looking at light curves is spikes where the brightness of a star shoots up suddenly. These are not transit events. These are often caused by flares, explosions on the surface of stars. The brightening of a flare is characterized by a sudden and dramatic increase in luminosity followed by a swift fall off.
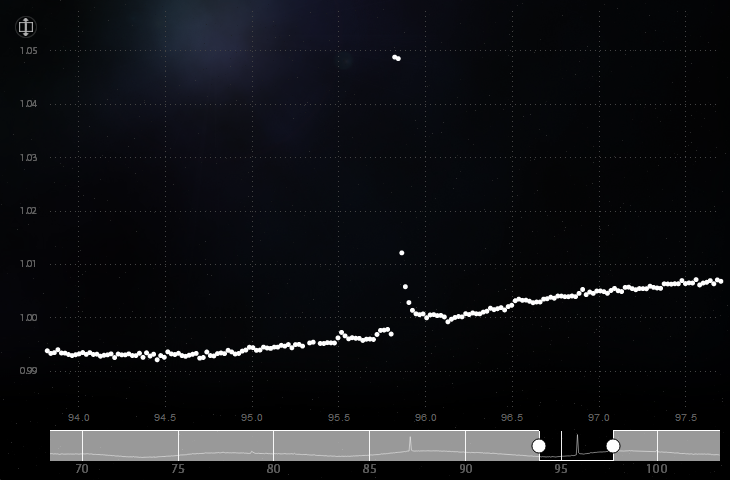
While unconnected to transits and the main focus of Planet Hunters, feel free to comment on flares using the talk interface and the discussion pages.
Gaps in the Light Curve
You may notice there are gaps in some sections of the light curves. These gaps are not due to transiting exoplanets, but instead occur because the Kepler spacecraft was not observing the Kepler field because it was sending data back to Earth or has entered safe mode.
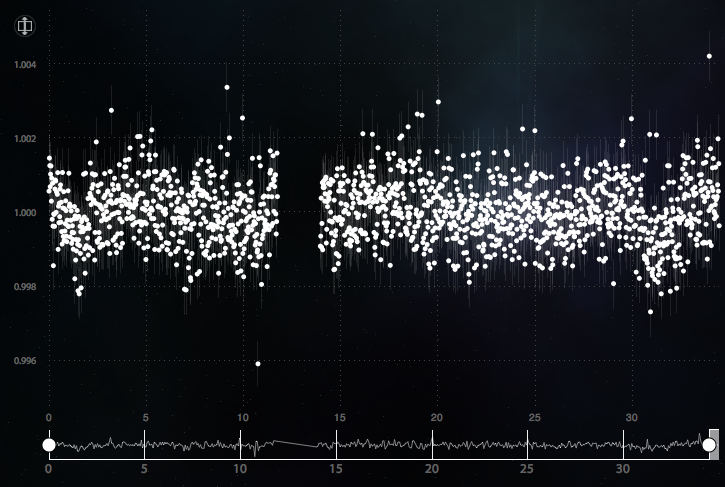
Single low points/Few scattered low
There should typically be more than 2 points comprising the transit. If you see one or two extreme low points scattered, these are likely not transits. They typically are spurious data points and should be ignored.
Here there are individual deviant points in the light curve, but there are no transits.
Here there are individual deviant points in the light curve, but there are no transits. GO TO TOP
Variable Stars
Having trouble classifying the different types of variable light curves? Look no further. Here are some examples and what the team thinks they are.
Irregulars
Pulsating
Regular
Quiet
Didn't find an answer to your question? Visit Planet Hunters Talk and ask the Planet Hunters community.