


Science
Learn more about the science of Planet Hunters
PLANET HUNTERS
Our Challenge
NASA's Kepler spacecraft is one of the most powerful tools in the hunt for extrasolar planets. The Kepler team's computers are sifting through the data, but we at Planet Hunters are betting that there will be planets which can only be found via the remarkable human ability for pattern recognition.
This is a gamble, a bet if you will, on the ability of humans to beat machines just occasionally. It may be that no new planets are found or that computers have the job down to a fine art. And yet, it's just possible that you might be the first to know that a star somewhere out there in the Milky Way has a companion, just as our Sun does. Fancy giving it a try?
GO TO TOPThe Kepler Public Data
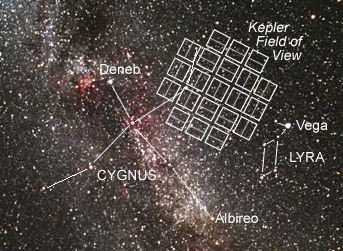 On March 2009, the NASA Kepler mission was launched with the goal of using the transit technique to detect exoplanets: terrestrial and larger planets orbiting other stars. With this method, planets that pass in front of their host stars block out some of the starlight causing the star to dim slightly for a few hours. The Kepler spacecraft stares at a field of stars in the Cygnus constellation and records the brightness of those stars every thirty minutes to search for transiting planets.
The time series of brightness measurements for a star is called a light curve. The Kepler spacecraft beams data for more than 150,000 stars to Earth at regular intervals. With every download of data, the time baseline of the light curves is extended.
The project's Principal Investigator, Bill Borucki, began planning the Kepler mission in the mid-1980's and his team has been hard at work for more than a decade. To reward them for this hard work, the Kepler team has advanced access to the light curves. We at Planet Hunters are not part of the NASA Kepler team. However, NASA is releasing light curves into the public archive to encourage broader participation and we think that the public can play an important role as our scientific partners in this latest Zooniverse project.
Since 1995, more than 500 exoplanets have been discovered by various techniques and it appears that roughly half of the stars in the sky have planets. There are some special challenges for planet detection with the transit technique:
- A special orientation of the orbit is required. Because the technique looks for a dimming in the brightness of the star, all of the planets with orbits that don’t pass between the star and our line of sight will be missed.
- Close-in planets are easier to detect. A transit event only occurs once per orbit; planets that are closer to their host stars race around their orbits faster than planets that orbit at larger distances. To confidently detect a transit, at least three dips in the brightness (i.e., three transit events) must occur. Thus, a planet that orbits in one year, like the Earth, requires three years of data for detection, while planets that orbit in ten days can be detected with just thirty days of data.
- Larger planets are easier to detect. The bigger the planet, the more starlight it blocks out. The Kepler mission measures the brightness of stars with such incredible precision that it is sensitive enough to detect transits of planets approaching the size of Earth.
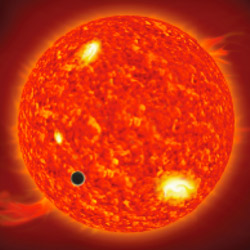
- Planets may be harder to detect against a variable brightness background. This turns out to be less of a problem than one might think. When we look at a light curve, we're seeing how the brightness changes with time. In the Figure below, there are starspots in addition to the transiting planet (lower left spot on the star). However, starspots rotate with the star and cause relatively slow changes in the brightness of the star. Transiting planets cross the star in hours and cause quick dips in the brightness of the star. Look below to see the difference (left image). Spots cause most of the smooth and slowly varying brightness and we're learning that many stars have much larger spots than the Sun.
Humans vs. Machines
The Kepler team has been developing computer algorithms to analyze light curve data because it is not possible for them to visually inspect every light curve. While we expect computer programs to robustly identify things that they are trained to find, we are betting that there will be a number of surprises in the data that the computer algorithms will miss.
The human brain is particularly good at discerning patterns or aberrations and experiments have shown that when many people work together, the collective wisdom of the crowds can be better than an expert. Planet Hunters is an online experiment that taps into the power of human pattern recognition. Participants are partners with our science team, who will analyze group assessments, obtain follow up observations at the telescope to understand the new classification schemes for different families of light curves, identify oddities, and verify transit signals.
GO TO TOPPlanet Hunters: Getting Started
Planet Hunters: Flagging Transit Events
However, the real treasure hunt is for transiting planets and these present as a relatively sharp dip in brightness in the light curve (Figure 3). A transit could appear in either a quiet or a variable curve. Indeed, it will be more difficult for computer algorithms to find transits imposed on the variable light curves, so we hope that Planet Hunters will pay particular attention to these.
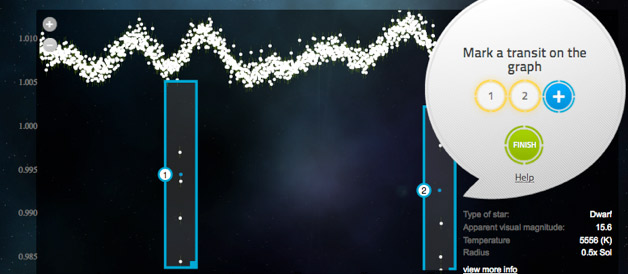
Figure 3. After sorting the light curves as quiet or variable, Planet Hunters will be asked if there are any possible transits in the data. If low points are seen, then answer 'yes' and click on the icon to create a box that can be positioned over the transit features.
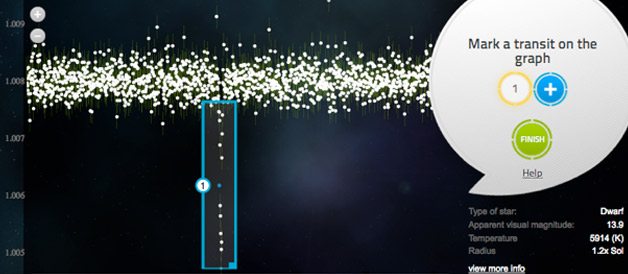
The size of the planet is reflected in the depth of the transit points. Earth-sized planets will exhibit a dip in brightness that is buried in the noise of the quiet light curves in Figure 1. The transit events in Figure 3 are for planets that are several times the radius of the Earth.
The time it takes a planet to complete one orbit is called the orbital period. For transiting planets, this can be determined by counting the number of days from one transit to the next. The examples in Figure 3 are fairly obvious. Planets in longer period orbits will be more challenging to detect, both for humans and for computers because a transit will not appear in every 30-day set of light curve data. Just because you don’t see a transit in the first block of data doesn't mean that there won’t be a transit in another set!
Large planets with short orbital periods are the easiest ones to detect. The most challenging detections will be small planets with long orbital periods. These will require patience and care, but are the real treasures in the Kepler data!
GO TO TOPI See a Transit!
What happens if Planet Hunters discover a possible transiting planet? We maintain a list of transiting planets that the Kepler team announces, so the first thing that will happen is that we will check that list. If the flagged transit event is for a star that the Kepler team are already keeping an eye on, we'll let you know. If this event has not been identified and several Planet Hunters are flagging the same data, the science team will investigate. If this appears to be a new discovery, then we will follow up to obtain spectroscopic data using the Keck telescope in Hawaii. If the transit candidate passes all of the screening tests, the result will be submitted for publication. Planet Hunters who discover new transiting planets will be included as co-authors on our papers.
GO TO TOPExperimental Data: Simulated Transits
One of the goal of Planet Hunters is to explore the diversity of the terrestrial and giant planet populations and begin to understand the spectrum of solar systems. How many Jupiter-sized planets are out there? How many Neptune-sized? Are solar systems like ours common?
With just the planet discoveries alone you can't answer these questions because you don't know how complete the sample is. This is because you don't know how sensitive to detecting planets of different types the project is, particularly since this is a new way to look for planets that has never been done before. If we found one earth-sized planet for example. We can't say anything about their abundance compared to gas giant planets, since we don’t know how many we might have missed in the data set. That’s where the simulated transits come in.
We added Kepler lightcurves into the Planet Hunters database with simulated transits, spanning the range of exoplanet radii and orbital periods, to test which kinds of transiting planets can be detected with Planet Hunters. If users flag 100% of the Jupiter-sized planets with orbital periods shorter than 30 days, but only 50% of the Neptune-size planets with orbital periods shorter than 30 days, then we know that the number of transiting Neptunes in the real light curves is a factor of two larger than what has been flagged. This provides a powerful statement about the fraction of transiting planets that could only be made with the Planet Hunters collective.
It might seem like we're testing you or trying to train you to identify transits, but we're really testing the project. The simulations are critical for determining the statistical completeness for planets as a function of size (depth of the transit event) and orbital period (number of transits). This is a really vital part of the project, with these simulated transits we can answer these really interesting and fundamental questions about how solar systems and planets form. Some of the simulated planets like large Jupiter-sized planets will be really easy to spot while others will be near impossible to identify especially for the extremely small planets, but don’t be discouraged if you didn’t find the simulated transit. That’s okay, that's part of the experiment. We don't know what Planet Hunters will be able to detect so we have to look at the look at range of possible planet radii and orbits.
We will always identify the simulated transit points in red after you’ve classified the star and list the radii and period of the simulated planet we injected into the light curve. The reason we don’t identify the simulated data first, is that if you knew the lightcurve had simulated events you might look at it differently. To be able to use the data from the simulated transits accurately, we need them to be examined in exactly the same conditions as the real lightcurves.
GO TO TOPMore about the Light Curves
Planet Hunters uses the publicly released light curves from the Kepler Mission. The first Kepler data release (Quarter 1) was approximately 35 days in duration, and the second data release (Quarter 2) spans ~90 days. We now have the first ~120 days of the Kepler science mission to search through. We have chosen to show sections of the light curve that are the same size as the first quarter (35 days), and therefore Quarter 2 light curves are broken into three sections. We have 5 days worth of overlap in each section, so that we don't miss any transits that happen at the starts and ends of where we separated the light curves.
You can tell which part of the light curve you are looking at by the APH#. The first two numbers are quarter and section. For example, APH22332480 is section 2 of Quarter 2. Quarter 1 lightcurves start with APH10. We use APH for the light curve sections and SPH for referring to the star itself. For the SPH numbers the first two numbers refer to what quarter the star first appeared in the public data set. For example, SPH21332480 first appeared is Quarter 2 Section 1. The star source pages (like http://www.planethunters.org/sources/SPH10129795) contain all the sections of light curve for you to review and the x-axis is the days from the first observation, so you can look for repeat transits in other sections of the light curve easily. Also available on the source page is a downloadable CSV file which contains all the available light curve data.
You may notice there are gaps in some sections of the light curves. These gaps in the data are typically due to the Kepler spacecraft not observing. The gaps are caused by a few different things: Kepler went into safe mode and wasn’t taking data, the spacecraft was rotating towards the Earth to send the data back to NASA, the spacecraft has executing a roll (or quarterly roll as its called) to reorient its solar panels, or the data quality is bad typically due to a cosmic ray hit on the detector.
GO TO TOP